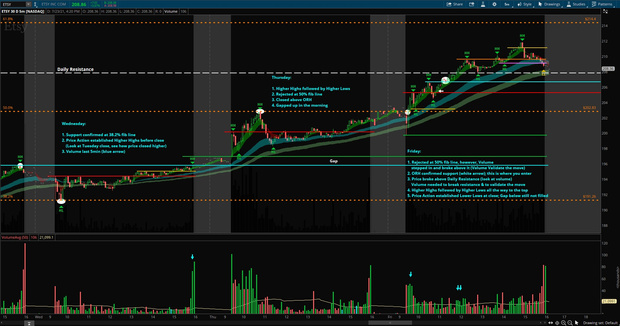

This is a hypothetical example for learning, not a promise or a prediction. The numbers below are made up to show how win rate, risk and reward work together. Most traders lose money, and results vary widely.
Let’s break the math down simply. You don’t need to swing for the fences every trade. In theory, you need consistency, discipline, and solid risk management.
Here’s the hypothetical:
✅ 63% win rate with 1:1 risk/reward (R/R)
✅ Risking $1,000 per trade
✅ 2 trades per day = about 5 winners and 3 losers per week
✅ 2R net profit per week
✅ $2,000 profit per week x 50 weeks = $100,000 in a year
On paper, that works with a $20,000 account. In real trading you would also face commissions, slippage, taxes, losing streaks, and a win rate that is hard to hold. Treat it as a way to see the math, not as a plan to copy.
What the example teaches
- Win rate: 63% means winning a bit more than half your trades. It is a made up number here, and many traders never hold a rate like that.
- 1:1 R/R: You are not relying on home runs. You are making what you risk.
- Consistency over big wins: Steady, repeatable results matter more than one big trade.
- Risk management: Risking 5% ($1,000 on $20,000) per trade is aggressive. Many traders risk far less, and a losing streak at this size can hurt an account quickly.
The big takeaway
The lesson is not the $100,000. The lesson is that a plan beats guessing.
You don’t need 10x trades.
You don’t need 100% winning weeks.
You do need:
- A process
- Discipline
- Confidence to execute
- A risk you can survive
Test any plan on paper first, and only risk money you can afford to lose. Nothing here is a guarantee.
Educational content only, not financial advice. See our Disclaimer.
Educational content only, not financial advice. Trading involves risk and most traders lose money. Read our Disclaimer.